


How to create an interactive donut chart using SVG
In this post, we'll make an SVG donut chart with clickable slices/parts. I'll start by explaining the issue with the most common way to implement an SVG donut chart (using stroke-dasharray and stroke-dashoffset). Then we'll talk about a new way to do it, I'll go over the math and SVG usage in great detail, and we'll finally implement the solution with React & Angular.
The problem with the stroke-dasharray implementation
Salomone Baquis talks about this in this post. This method uses the stroke-dasharray and stroke-dashoffset properties to draw a slice of border around SVG circles. Read the post to see how he do it.
The problem is that we can't interact we the slices. For example, we can't change the color of the slice on hover or do something when the slice is clicked.
Because, to draw the slices we have to draw an entire circle and color parts of its border. So the circles go on top of each other and only the last circle is interactive. Think of this as positioning multiple HTML elements in the same spot. The element with the highest z-index hides all the other elements below it. Have a look at the illustration below, and pay attention to the ID of the circle that is highlighted (42).
Path to the rescue
What we want is something like this:
To do this we will draw each donut slice using a <path>. The <path> element is the most powerful element in the SVG library of basic shapes. It can be used to create lines, curves, arcs, and more.
The shape of a <path> element is defined by one parameter: d. The d attribute contains a series of commands and parameters used by those commands (Docs here).
To draw the slices we need only three commands:
- M [x] [y]: Move to the x,y position
- L [x] [y]: Draw line from the previous position to the x,y position
- A [x radius] [y radius] [x-axis-rotation] [large-arc-flag] [sweep-flag] [x] [y]: Draw an arc from the previous position to the x,y position
The move and line commands are pretty straightforward. The arc command is more complex, but don't worry we will see how to use each of its params.
Let's say we have an SVG with the following viewBox: viewBox="0 0 100 100". The most top-left point is 0,0 and the most bottom-right point is 100,100.
Let's build a quarter of a circle (multiple of a quarter are the easiest because we know their x, y positions):
<svg viewBox="0 0 100 100">
  <path fill="tomato"
             d="M 100 50
               A 50 50 0 0 0 50 0
               L 50 50"
  />
</svg>
So, we moved to the point 100, 50, then we drew an arc (with a radius of 50) to the 50, 0 point. And finally, we drew a line back to the center (50, 50).
ℹ️ The SVG closes automatically, so we don't have to draw a line back to the starting position (100, 50).
So far we have this (I outlined the SVG with a black border):

Now let's play with the different flags to understand them.
Let's start with the sweep-flag. Say we set it to true (1), we have this:

The arc went from convex to concave. This flag determines if the arc should begin moving at positive angles or negative ones, which essentially picks which of the two circles will be traveled around. We will talk more about this in a second.
Let's move on to the large-arc-flag, if we set it to 1, we have this:

This flag determines if the arc should be greater than or less than 180 degrees; in the end, this flag determines whether we take the short route to the point or the long one.
Now let's enable both of these flags. This is what we get:

We get this because we took the longest route to the point (50, 0), and we move there while taking a negative angle direction.
With this, we are set to move on to the drawing of the chart. But before we do, we have to talk about some basic trigonometry.
Trigonometry
Pie chart slice
Let's say we want the position of this point (at 45°):
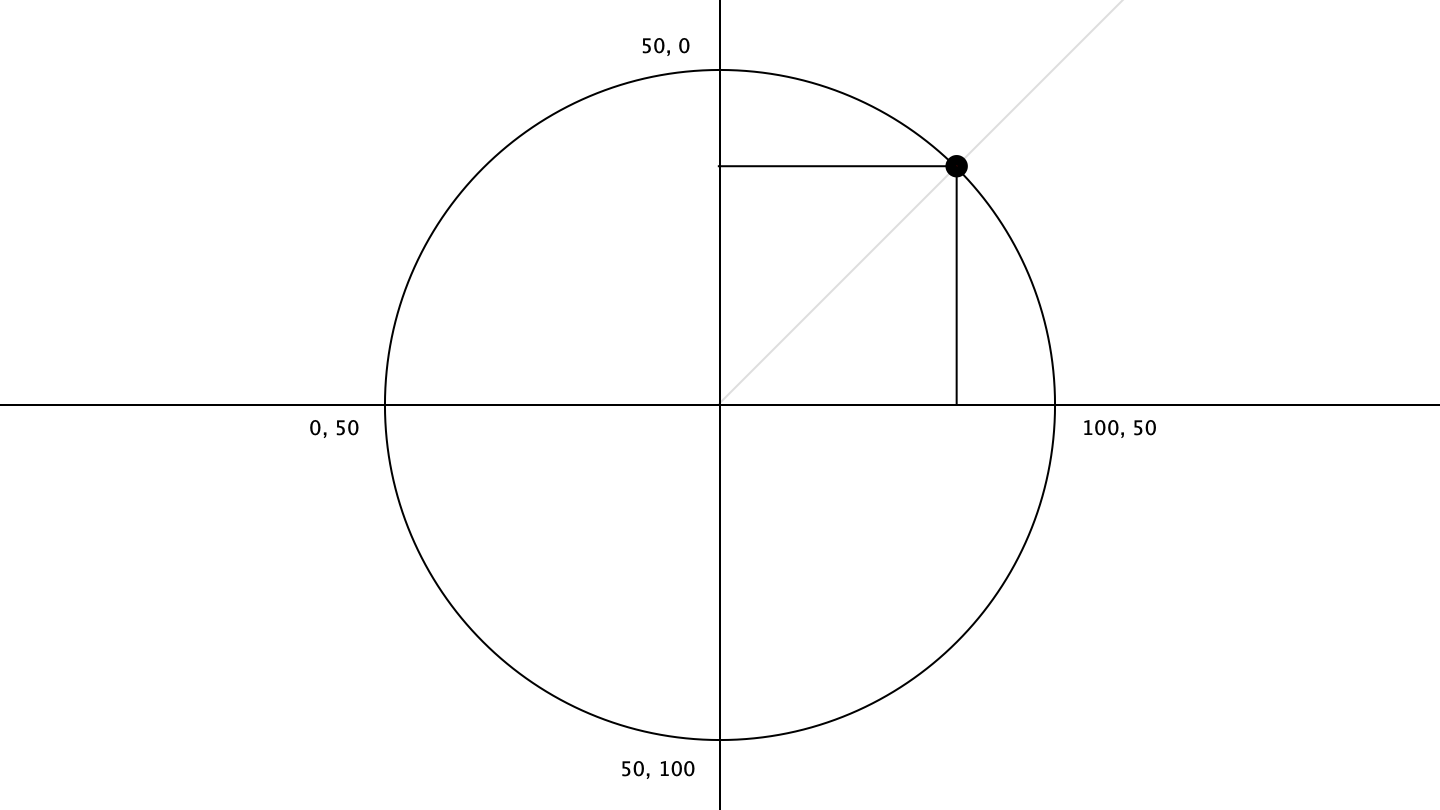
To find its position we have to do some trigonometry. For now, left put aside the radius and the positions of the SVG viewBox. Let's say we have a circle of a radius of one:
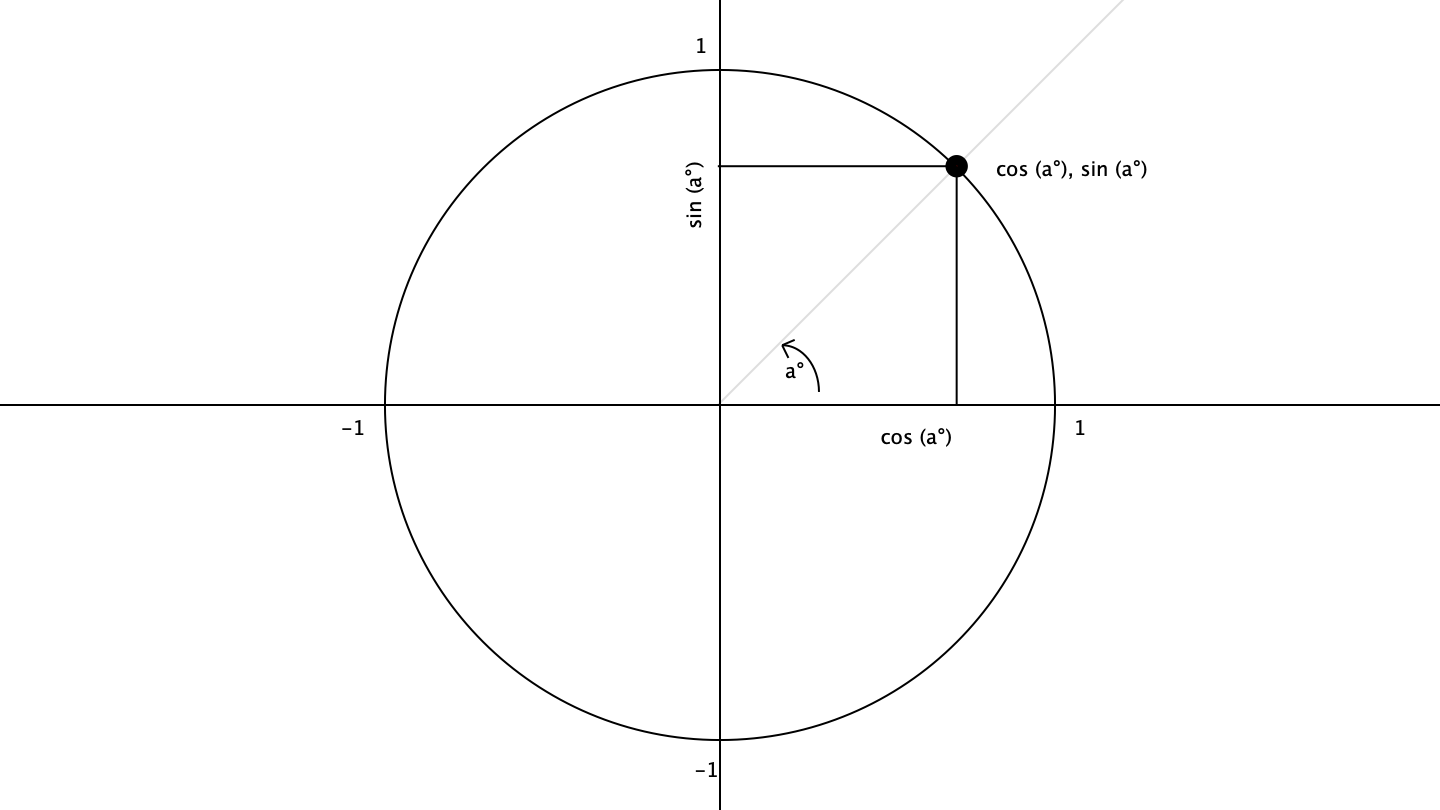
To get the coordinate of the point, we have to do cos(angle) for the horizontal position and sin(angle) for the verticle position. The angle must be in radiants so if we want the position of our point that is placed at 45 degrees we have to first transform it to radiant. To do this we multiply it by PI and we divide by 180.
So the point position is the following:
const position = [
   Math.cos(45 * Math.PI / 180),
   Math.sin(45 * Math.PI / 180)
]
// [0.707106781186547, 0.707106781186547]
Now if we want to place this point in our SVG, we have to transform the horizontal and vertical positions to make sure our point is positioned correctly in our circle. For this, we should multiply the x position by the radius then add the horizontal size of the SVG. And, for the vertical position, we have to multiply it by minus the radius and then we add the vertical size of the SVG. If we implement a function to do this we would have the following:
function getCoordFromDegrees(angle, radius, svgSize) {
    const x = Math.cos(angle * Math.PI / 180);
    const y = Math.sin(angle * Math.PI / 180);
    const coordX = x * radius + svgSize / 2;
    const coordY = y * -radius + svgSize / 2;
    return [coordX, coordY];
}
getCoordFromDegree(45, 50, 100); // [85.35499, 14.64500]
If we use this in our SVG we would have this:
<svg viewBox="0 0 100 100">
  <path fill="tomato"
             d="M 100 50
               A 50 50 0 0 0 85.35499, 14.64500
               L 50 50"
  />
</svg>

Donut chart slice
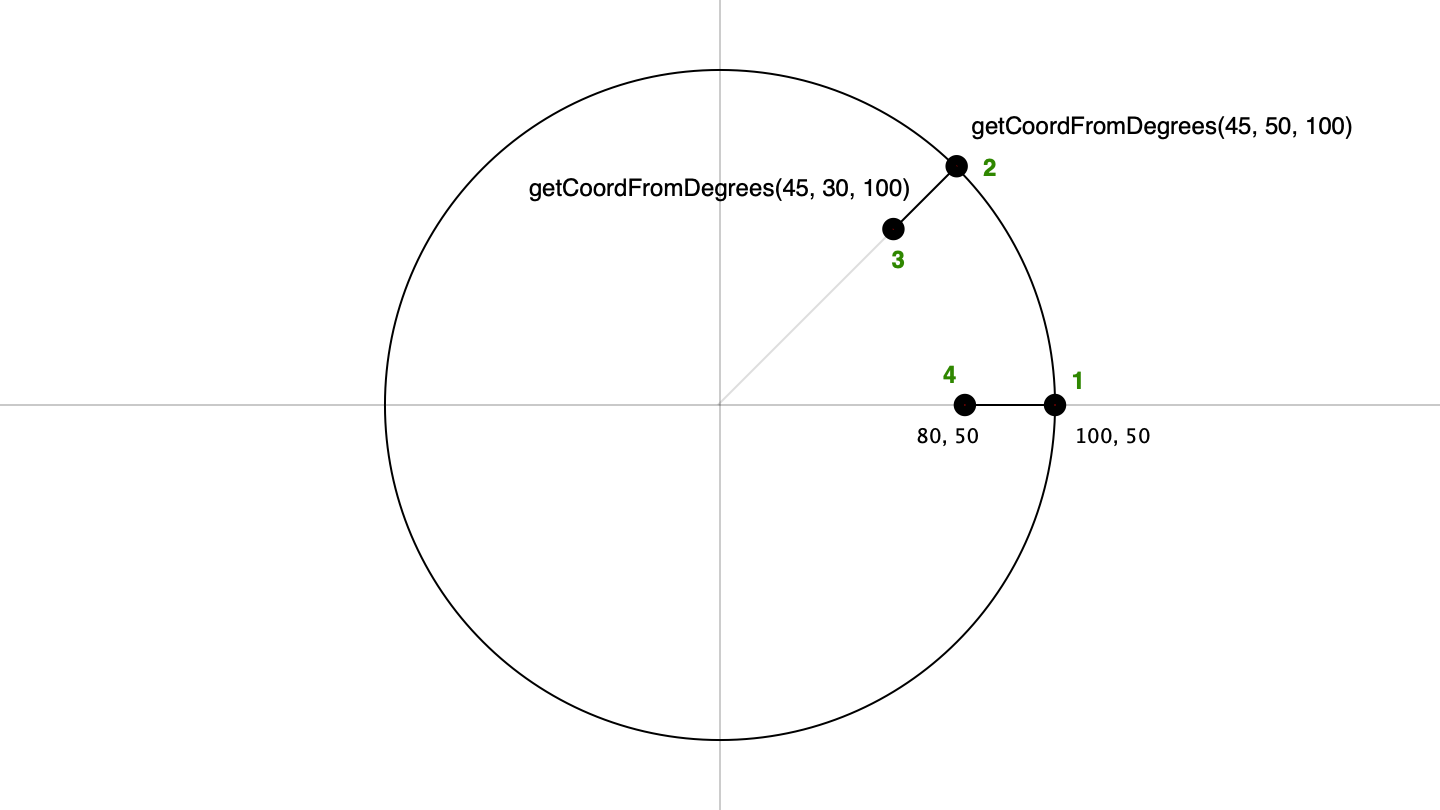
To go from the pie slice to the donut slice we have to calculate two more points. Instead of going back to the center, we stop before. Let's say we want a donut border to be 20 units large (remember the view box is 100 by 100), so we need to draw a line to getCoordFromDegrees(45, 30, 100) (30 because radius - 20).
Finally, we go back to starting position minus 20 horizontal units. Remember to set the sweep-flag to 1 because of the negative direction.
Have a look at the illustration below:
<svg viewBox="0 0 100 100">
  <path fill="tomato"
        d="M 100 50
          A 50 50 0 0 0 85.35499 14.64500
          L 71.213 28.78700
          A 30 30 0 0 1 80 50"
  />
</svg>

A slice bigger than 180 degrees
If a slice is bigger than 180 degrees remember that we have to tell the SVG to take the longest route (by default it will take the shortest). For that, we set the large-arc-flag to 1.
Stacking up multiple slices/parts
We are almost there, we now need to place the slices where they should be. Let's say the first slice is the green one with 270 degrees, the next one is the purple with 45 degrees, and then the blue one also with 45 degrees. So we need to rotate the second one by 270 degrees and the third one by 315 degrees (270 + 45).

ℹ️ We also need to set the transform-origin of the path to center (transform-origin: center;) since we rotate it relatively to the center.
Implementation
So to do this, we first need to set up the interface that we will expose to the other components and an internal interface that the donut chart component needs to work correctly:
export interface DonutSlice {
  id: number;
  percent: number;
  color: string;
  label?: string;
  onClickCb?: () => void;
}

interface DonutSliceWithCommands extends DonutSlice {
  offset: number; // This is the offset that we will use to rotate the slices
  commands: string; // This will be what goes inside the d attribute of the path tag
}
React
There are a million ways to do it, this is how I implemented it. First I created a helper class to do the calculus, It will transform each DonutSlice to a DonutSliceWithCommands (You may want to put it in a separated file in a real world project). Then I created a function component to loop through the slices:
class CalculusHelper {
  getSlicesWithCommandsAndOffsets(
    donutSlices: DonutSlice[],
    radius: number,
    svgSize: number,
    borderSize: number
  ): DonutSliceWithCommands[] {
    let previousPercent = 0;
    return donutSlices.map((slice) => {
      const sliceWithCommands: DonutSliceWithCommands = {
        ...slice,
        commands: this.getSliceCommands(slice, radius, svgSize, borderSize),
        offset: previousPercent * 3.6 * -1,
      };
      previousPercent += slice.percent;
      return sliceWithCommands;
    });
  }

  getSliceCommands(
    donutSlice: DonutSlice,
    radius: number,
    svgSize: number,
    borderSize: number
  ): string {
    const degrees = this.percentToDegrees(donutSlice.percent);
    const longPathFlag = degrees > 180 ? 1 : 0;
    const innerRadius = radius - borderSize;

    const commands: string[] = [];
    commands.push(`M ${svgSize / 2 + radius} ${svgSize / 2}`);
    commands.push(
      `A ${radius} ${radius} 0 ${longPathFlag} 0 ${this.getCoordFromDegrees(
        degrees,
        radius,
        svgSize
      )}`
    );
    commands.push(
      `L ${this.getCoordFromDegrees(degrees, innerRadius, svgSize)}`
    );
    commands.push(
      `A ${innerRadius} ${innerRadius} 0 ${longPathFlag} 1 ${
        svgSize / 2 + innerRadius
      } ${svgSize / 2}`
    );
    return commands.join(' ');
  }

  getCoordFromDegrees(angle: number, radius: number, svgSize: number): string {
    const x = Math.cos((angle * Math.PI) / 180);
    const y = Math.sin((angle * Math.PI) / 180);
    const coordX = x * radius + svgSize / 2;
    const coordY = y * -radius + svgSize / 2;
    return [coordX, coordY].join(' ');
  }

  percentToDegrees(percent: number): number {
    return percent * 3.6;
  }
}

export default ({
  data,
  radius,
  viewBox,
  borderSize,
  clickCb,
}: {
  data: DonutSlice[];
  radius: number;
  viewBox: number;
  borderSize: number;
  clickCb: (slice: DonutSlice) => void
}) => {
  const helper = new CalculusHelper();
  return (
    data && (
      <svg viewBox={'0 0 ' + viewBox + ' ' + viewBox}>
        {helper
          .getSlicesWithCommandsAndOffsets(data, radius, viewBox, borderSize)
          .map((slice) => (
            <path
              onClick={() => clickCb(slice)}
              fill={slice.color}
              d={slice.commands}
              transform={'rotate(' + slice.offset + ')'}
            >
              <title>{slice.label}</title>
            </path>
          ))}
      </svg>
    )
  );
};
You can find the stackBlitz here.
Angular
We will first implement a pure pipe that takes an array of DonutSlice and return an array of DonutSliceWithCommands:
@Pipe({
  name: 'slicesWithCommandsAndOffset',
  pure: true,
})
export class DonutChartPipe implements PipeTransform {

  transform(donutSlices: DonutSlice[], radius: number, svgSize: number, borderSize: number): DonutSliceWithCommands[] {
    let previousPercent = 0;
    return donutSlices.map(slice => {
      const sliceWithCommands: DonutSliceWithCommands = {
        ...slice,
        commands: this.getSliceCommands(slice, radius, svgSize, borderSize),
        offset: previousPercent * 3.6 * -1, // we multiply by -1 because CSS rotation move in clockwise direction whereas degrees move in counter-clockwise direction
      };
      previousPercent += slice.percent;
      return sliceWithCommands;
    });
  }

  getSliceCommands(donutSlice: DonutSlice, radius: number, svgSize: number, borderSize: number): string {
    const degrees = this.percentToDegrees(donutSlice.percent);
    const longPathFlag = degrees > 180 ? 1 : 0;
    const innerRadius = radius - borderSize;

    const commands: string[] = [];
    commands.push(`M ${ svgSize / 2 + radius } ${ svgSize / 2 }`);
    commands.push(`A ${ radius } ${ radius } 0 ${ longPathFlag } 0 ${ this.getCoordFromDegrees(degrees, radius, svgSize) }`);
    commands.push(`L ${ this.getCoordFromDegrees(degrees, innerRadius, svgSize) }`);
    commands.push(`A ${ innerRadius } ${ innerRadius } 0 ${ longPathFlag } 1 ${ svgSize / 2 + innerRadius } ${ svgSize / 2 }`);
    return commands.join(' ');
  }

  getCoordFromDegrees(angle: number, radius: number, svgSize: number): string {
    const x = Math.cos(angle * Math.PI / 180);
    const y = Math.sin(angle * Math.PI / 180);
    const coordX = x * radius + svgSize / 2;
    const coordY = y * -radius + svgSize / 2;
    return [coordX, coordY].join(' ');
  }

  percentToDegrees(percent: number): number {
    return percent * 3.6;
  }
}
Finally, we implement the component that loops through the array of DonutSliceWithCommands:
@Component({
  selector: 'app-donut-chart',
  styleUrls: ['./donut-chart.component.scss'],
  changeDetection: ChangeDetectionStrategy.OnPush,
  template: `
    <svg [attr.viewBox]="'0 0 ' + viewBox + ' ' + viewBox" *ngIf="data">
      <path *ngFor="let slice of data | slicesWithCommandsAndOffset:radius:viewBox:borderSize;
                    trackBy: trackByFn;
                    let index = index"
            [attr.fill]="slice.color"
            [attr.d]="slice.commands"
            [attr.transform]="'rotate(' + slice.offset + ')'"
            (click)="slice.onClickCb ? slice.onClickCb() : null"
      >
        <title></title>
      </path>
    </svg>
  `,
})
export class DonutChartComponent implements OnInit {
  @Input() radius = 50;
  @Input() viewBox = 100;
  @Input() borderSize = 20;
  @Input() data: DonutSlice[] = [];

  ngOnInit() {
    const sum = this.data?.reduce((accu, slice) => accu + slice.percent, 0);
    if (sum !== 100) {
      throw new Error(`The sum of all slices of the donut chart must equal to 100%. Found: ${ sum }.`);
    }
  }

  trackByFn(index: number, slice: DonutSlice) {
    return slice.id;
  }
}
You can find the stackBlitz here.
That's it for this post. I hope you liked it. If you did, please share it with your friends & colleagues and follow me on Twitter at [@theAngularGuy](https://twitter.com/TheAngularGuy) where I tweet about web development and computer science.
Cheers!